Orange County Housing Report: Q12016 – OC Housing is Resilient
After a shaky start, Orange County housing is proving to be
durable and strong.
A 1st Quarter Overview: The housing market continues to lean in favor of the seller.
Due to worldwide stock market and economic turbulence, the
Orange County housing market had a very sluggish start to the year. It seemed
as if housing was lying face down in the dirt of the economic arena. The
four-year hot seller’s market appeared to be bruised and battered and ready to
begin tilting slowly to the buyer’s favor. In spite of very little supply,
buyers were unilaterally balking at higher prices and were unwilling to stretch
and pay a little bit more than the most recent sale. As a result, demand was
off.
This is where the resilience of housing stepped in. The
Orange County housing market got up from the dirt of the economic arena,
brushed itself off, flexed its massive muscles, displaying its incredible
strength and endurance, and surged forward. The hot market came back with a
vengeance. Here’s a breakdown of the current OC housing trends:
- After a slow start, the active
listing inventory is rising, but will remain well below the long term average. After starting the year with the second lowest inventory
behind the extremely anemic 2013 housing market, it seemed as if there would
not be enough homes to satiate buyers’ demand leftover from 2015. There were 7%
fewer homes coming on the market through mid-February compared to the prior year.
As the worldwide financial volatility found its footing, more homes started
coming on the market. By the end of the first quarter, the exact same number of
homes had come on the market as 2015. The slow start was replaced with an
eagerness for homeowners to sell again, and they made up for lost time. The
inventory had grown by 30% since ringing in the New Year. There are 2% more
homes on the market today compared to last year due to the fact that demand is
off a bit. Fewer new pending sales mean a higher inventory. The long term
average inventory since 2005 is 9,238. The current active listing inventory is
at 5,732, nearly 38% off the average. The trend is for the inventory to
continue to grow at a slow methodical pace, peaking in mid-August right above
the 7,000 home mark.
- Demand has regained its
strength and looks a lot more like 2015. After an initial
strong start, demand was 10% higher than the start to 2015, buyers quickly
adjusted to the continuously streaming news of the stock market turbulence and
demand slowed. It actually took an unprecedented drop after the first two weeks
of January. As a result, after the first two months, demand was off by 11%. By
the end of the first quarter, demand was only 3% less than 2015, and the Orange
County housing market was humming along on all cylinders. The trend is for
demand to remain strong through the second quarter, the hottest time of the
year in terms of activity. It will then decelerate in July, like it cyclically
does during every Summer Market.
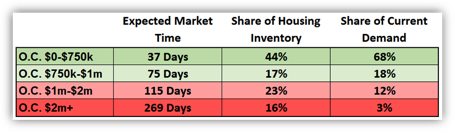
- Every seller and buyer MUST
understand that the lower the price range, the hotter the market; AND, the
higher the price range, the slower the market. Not all price ranges behave the same. There are four vastly
different market in Orange County. Below $750,000 is red hot. Price a home in
good condition close to the Fair Market
Value and it will generate multiple offers and will often sell at or above
the asking price. With an expected market time of only 37 days, home values are
climbing and it is a deep seller’s market. This range represents 44% of the
active inventory and 68% of all demand. The second hottest price range, homes
priced between $750,000 and $1 million has an expected market time of 75 days.
This is a slight seller’s market, meaning that they are able to call the shots
in negotiating a sale with a buyer, but values are not appreciating. Overprice
in this range and sellers will sit. The third range, homes priced between $1
million and $2 million, is slow at 115 days, but will eventually move when priced
accurately. The final price range, homes priced above $2 million, is extremely
sluggish with an expected market time of 269 days. It accounts for 16% of the
entire inventory, yet only 3% of demand. There just are too many sellers
competing for a very small pool of buyers.
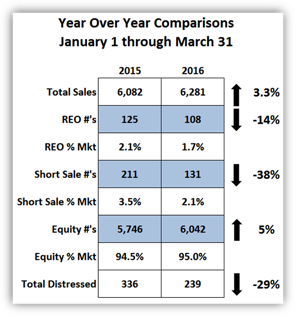
- Closed sales are slightly up compared to 2015, but that trend changed in March. For the residential resale market, closed sales were up by 10% for January, up 5% in February, and down 5% in March. Overall, the first quarter saw closed sales up 3.3%. Demand has been less than 2015 levels since mid-January. In turn, that means that sales will be less as well. That trend will continue as long as demand trails the prior year. It is also important to note that distressed sales are way down. Foreclosures are down 14% and short sales are down 38% compared to 2015. Distressed seemingly vanished in 2014, and every year its impact has become less and less. This year is no exception. There were only 239 total distressed closed sales in the first quarter. Compare that to 336 last year, 416 in 2014, a staggering 1,573 in 2013, and a mind blowing 2,779 in 2012. Distressed has gone from 55% of the market in 2012 to just 5% today.
Conclusion: from here, we can expect a
market very similar to 2015 with slightly less demand, resulting in slightly
fewer closed sales.
Active Inventory: The inventory increased by 5% in the past
two weeks.
The active inventory increased by 267 homes in the past
two weeks and now sits at 5,732. Every price range, except for homes priced
below $500,000, experienced an increase.
The trend does not look like it is going to methodically
increased like it did in 2014; instead, it looks like it will be a lot more
sporadic like 2015. Ultimately, it will peak somewhere between 7,200 and 8,000
homes in mid-August. The eventual height depends upon future evolutions in the
housing market.
Last year there were 108 fewer homes on the market, 2%
less.
Demand: In the past two-weeks demand increased by 4%.
Demand, the number of new pending sales over the prior
month, increased by 103 homes in the past two-weeks, and now totals 2,999, the
highest level since June of last year. After an initial slow start to the year
in terms of demand, it has recovered nicely and is beginning to follow closer
to last year’s path. The expected market time for all of Orange County is 57
days.
Last year at this time demand was at 3,107 pending sales,
108 more than today, with an expected market time of 54 days.
Summary:


